 Speed Log
Case study
A custom build by Tahuya River Software
A phone, a tape measure, and a speed you can show people.
Measure two points on the ground and film each car passing them in slow motion. Speed Log turns the video into a logged speed estimate, a marked frame for each car, and a report you can share with a neighbor, a board, or the city.
Try the marking step
These cars are drawn, not filmed. Nothing leaves your browser.
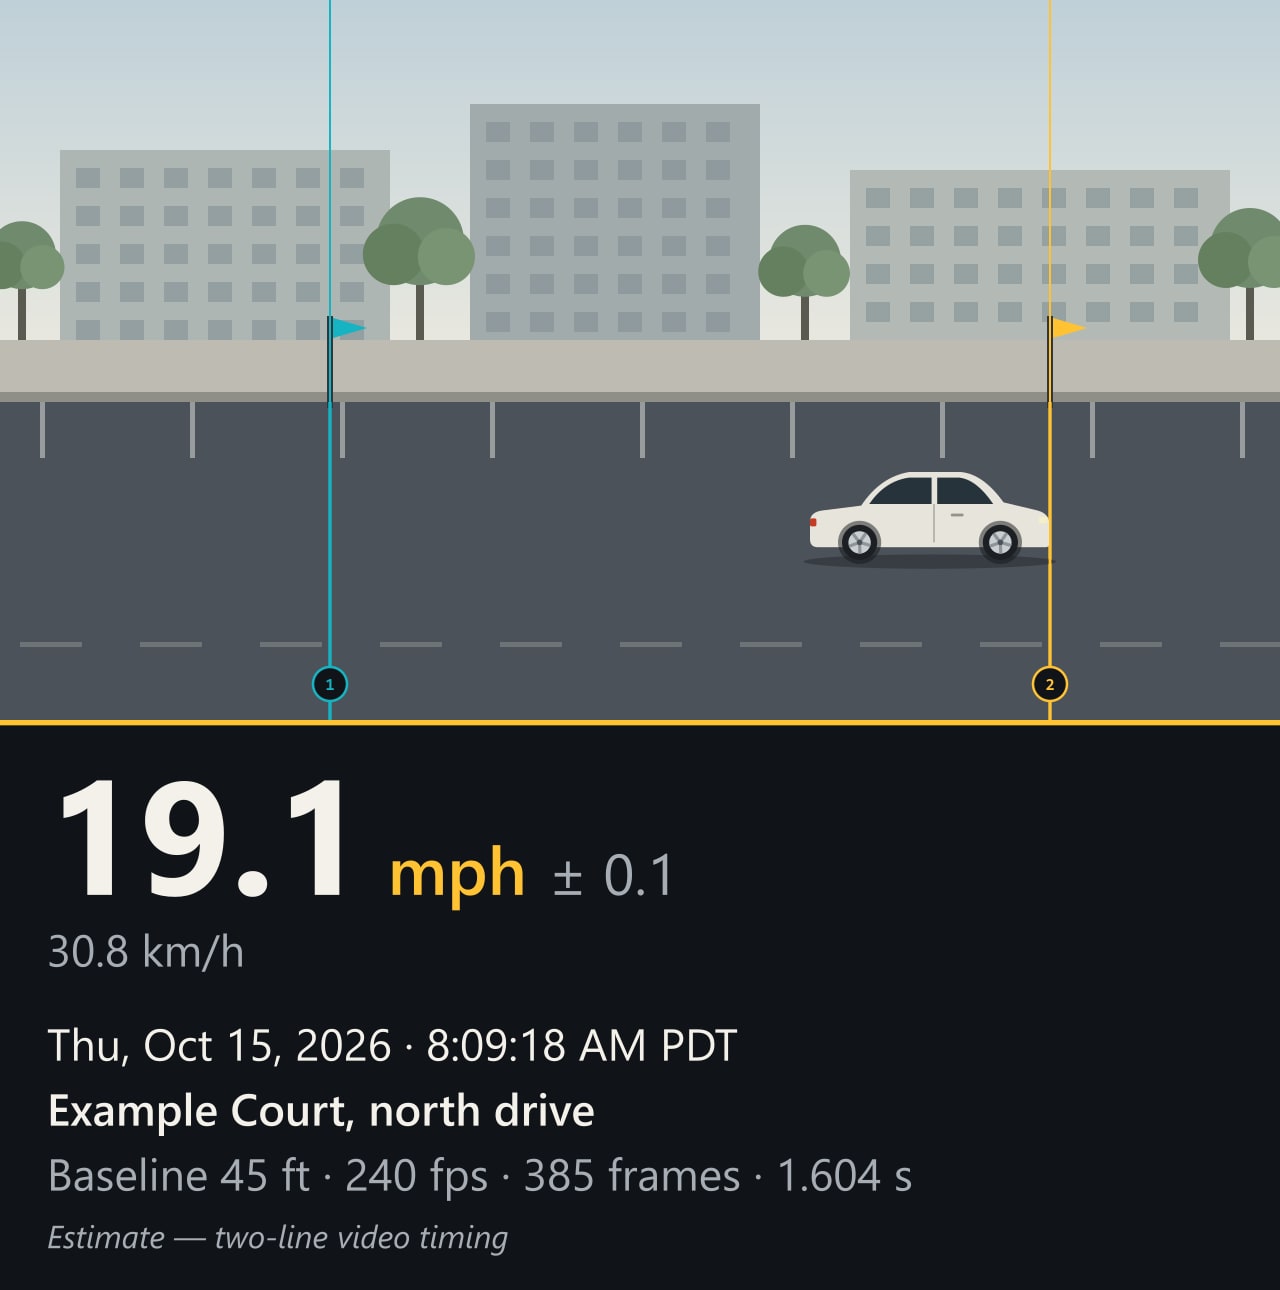
What you end up with
- A log. Every car with its speed, range, time and place. Export the ones you pick as a spreadsheet or a PDF.
- A report to share. One read-only link with charts by hour and day, the marked frames, and a plain explanation of the method.
- Numbers that show their work. Each speed carries a ± range and the figures behind it, so anyone can check the math.
- Median
- 14.1 mph
- Over 15 mph
- 13 of 38
- Fastest
- 21.9 mph
The sample report is made up from start to finish: its cars, place, dates and readings.
How close is it?
Computer-generated test clip at a known speed
25.05 ± 0.17 mph measured
25.00 mph actual
Speed Log gives estimates from video. It isn’t radar or lidar, this test isn’t a certification, and its results aren’t meant for citations. How close you get also depends on how carefully the two points were measured and how the camera was set up.
Who made this
Tahuya River Software built Speed Log as a stand-alone project, separate from our towing software. If you have a job a spreadsheet or an off-the-shelf app doesn’t quite do, tell us about it.